Every spring, millions of homeowners across the Northeast make the same mistake. They pick a weekend in early April, grab a bag of pre-emergent from the hardware store, and spread it across their lawn because the calendar says it's time. Some years that works. Some years the crabgrass still wins. The problem isn't the product. The problem is that calendar dates don't account for the one variable that actually controls when weeds, insects, and grass wake up: accumulated heat.
Growing degree days (GDD), explained simply: GDD measures cumulative heat accumulation over time, starting January 1. For lawn care, GDD base 50°F (called GDD50) is the standard. It predicts biological events like crabgrass germination (200 GDD50, approximately April 21 on Long Island), pre-emergent timing (100 GDD50, approximately April 6), and pest emergence more accurately than calendar dates because it adjusts for year-to-year weather differences. On Long Island, the annual GDD50 total is approximately 3,500, accumulated primarily between May and October.
Why Calendar Dates Fail
Here's a scenario. Your neighbor applied pre-emergent on March 28 last year and had zero crabgrass all summer. So this year, you do the exact same thing on March 28. But this spring was cooler. The soil didn't warm as fast. Your pre-emergent started degrading in the ground weeks before crabgrass even thought about germinating. By June, you've got crabgrass everywhere and your neighbor (who got lucky with a warm spring) is sitting pretty.
The issue is that biology doesn't follow a calendar. Crabgrass doesn't germinate because it's April 15. It germinates because the soil has absorbed enough total heat to trigger its growth cycle. Some years that happens in early April. Other years it's late April. Cornell Cooperative Extension's Jamesport soil monitoring data shows that the same soil temperature threshold can vary by 7 to 16 days from year to year on Long Island.
On Long Island, the date when soil reaches 55°F at 4-inch depth (a common pre-emergent trigger) has ranged from as early as late March to as late as mid-April in recent years. That's a three-week swing. If you're using a fixed calendar date, you're gambling.
Growing degree days solve this problem. Instead of asking "what date is it?" you ask "how much total heat has accumulated?" The answer tells you exactly where weeds, insects, and your grass are in their biological clocks, regardless of what the calendar says.
What Are Growing Degree Days? (The Simple Version)
Think of it like a piggy bank for heat. Every day, you check the temperature. If the average temperature for that day is above a baseline (50°F for lawn care), the extra degrees go into the piggy bank. If it's below 50°F, nothing goes in. You keep adding to this bank every single day starting January 1. The running total is your growing degree day accumulation.
Why does this matter? Because every biological event in your lawn, from crabgrass germination to grub emergence to your grass breaking dormancy, happens at a specific piggy bank total. Not a specific date. The total. When the bank hits 100, pre-emergent season opens. When it hits 200, crabgrass starts germinating. When it hits 1,000, Japanese beetles are at peak activity. The dates change every year, but the totals stay remarkably consistent.
GDD doesn't measure today's temperature. It measures the total accumulated warmth since January 1. That cumulative number is what triggers biological events in your lawn, weeds, and pests. Same total, same biological stage, regardless of what month it is.
How to Calculate GDD (It's Easier Than You Think)
The math is genuinely simple. One formula, three steps.
Get the day's high and low temperature
Check your local weather station or weather app. For example, today's high is 68°F and the low is 44°F.
Calculate the average
Add the high and low together, then divide by 2. So (68 + 44) / 2 = 56°F average.
Subtract the base temperature
For lawn care, we use base 50°F (that's why it's called GDD50). So 56 minus 50 = 6 GDD. If the result is negative, it's just zero for that day. Nothing goes in the bank.
That's it. Add each day's GDD to the running total. After a week of early April weather on Long Island, your bank might look something like this:
Sample GDD50 Calculation (Early April, Long Island)
Monday: High 58°F / Low 38°F → 0 GDD (Bank: 82)
Average: (58 + 38) / 2 = 48°F. That's below the 50°F base, so no GDD earned today. The bank stays at 82.
Tuesday: High 62°F / Low 42°F → 2 GDD (Bank: 84)
Average: (62 + 42) / 2 = 52°F. That's 2 degrees above the 50°F base. Deposit 2 into the bank. Running total: 82 + 2 = 84.
Wednesday: High 65°F / Low 45°F → 5 GDD (Bank: 89)
Average: (65 + 45) / 2 = 55°F. That's 5 above base. Deposit 5. Running total: 84 + 5 = 89.
Thursday: High 60°F / Low 40°F → 0 GDD (Bank: 89)
Average: (60 + 40) / 2 = 50°F. Exactly at the base. No degrees above it, so nothing goes in. Bank stays at 89.
Friday: High 68°F / Low 44°F → 6 GDD (Bank: 95)
Average: (68 + 44) / 2 = 56°F. That's 6 above base. Deposit 6. Running total: 89 + 6 = 95. Getting close.
Saturday: High 70°F / Low 48°F → 9 GDD (Bank: 104) ✅ PRE-EMERGENT TRIGGER
Average: (70 + 48) / 2 = 59°F. That's 9 above base. Deposit 9. Running total: 95 + 9 = 104. The bank just crossed 100. This is your pre-emergent signal.
Sunday: High 64°F / Low 46°F → 5 GDD (Bank: 109)
Average: (64 + 46) / 2 = 55°F. That's 5 above base. Deposit 5. Running total: 104 + 5 = 109. Pre-emergent should already be down and watered in by now.
See that? By Saturday, the cumulative GDD50 crossed 100. That's your pre-emergent signal. On a different year where April starts cooler, that 100 threshold might not arrive until a week later. GDD captures that difference automatically.
Track GDD50 Live with Weather Hub
The Blade Boss Weather Hub inside Lawn Map Pro™ monitors growing degree day accumulation and soil temperature estimates in real time for your ZIP code. Get alerts when key GDD thresholds approach so you never miss a window.
The Blade Boss Weather Hub inside Lawn Map Pro™ tracks GDD50 accumulation automatically for your ZIP code. NOAA's regional climate centers and Cornell's Northeast Regional Climate Center also publish GDD data. The math is simple if you want to track it manually, but there's no need to do it by hand.
GDD50 vs. GDD32: Which One Matters for Lawns?
You'll see two base temperatures used in GDD calculations. GDD50 (base 50°F) is the standard for lawn care because 50°F is the temperature at which cool-season grasses, most weeds, and most turf insects begin active biological development. GDD32 (base 32°F) counts heat above freezing, so it accumulates faster and across more of the year. GDD32 is used in some agricultural and forestry applications, but for everything we're doing with lawns, GDD50 is the number that matters.
The Long Island GDD50 Accumulation Curve
This is where it gets useful. Based on NOAA 1991 to 2020 climate normals for the Islip MacArthur Airport station (USW00004781), here's how GDD50 accumulates across the year on Long Island. This is the curve that drives every timing recommendation on our live zone calendar.
| Month | Monthly GDD50 | Cumulative GDD50 | What's Happening |
|---|---|---|---|
| January | 0 | 0 | Full dormancy. Nothing accumulating. |
| February | 0 | 0 | Still dormant. Soil frozen or near-frozen. |
| March | 59 | 59 | First heat units accumulating. Dormancy breaking. |
| April | 194 | 253 | Pre-emergent window. Grass waking up. |
| May | 430 | 683 | Rapid accumulation. Crabgrass germinating. Peak spring growth. |
| June | 599 | 1,282 | Fastest monthly accumulation. Summer stress approaching. |
| July | 767 | 2,049 | Peak heat. Summer dormancy zone for cool-season grass. |
| August | 658 | 2,707 | Still hot. Fall planning begins. |
| September | 481 | 3,188 | Accumulation slowing. Fall renovation window opens. |
| October | 228 | 3,416 | Significant slowdown. Winterizer window. |
| November | 67 | 3,483 | Minimal accumulation. Season winding down. |
| December | 17 | 3,500 | Essentially zero. Full dormancy returns. |
Notice the pattern. GDD50 is essentially zero through February, starts trickling in March, then explodes from May through August. That explosion is the biological engine that drives everything: grass growth, weed germination, insect activity, and disease pressure. By October, accumulation drops off sharply. By November, it's basically done for the year.
These are 30-year averages. In any given year, the actual dates can shift by 7 to 16 days. A warm March pushes everything earlier. A cold, rainy April delays everything. That's exactly why GDD tracking beats calendar dates. Track the actual accumulation, not the expected accumulation.
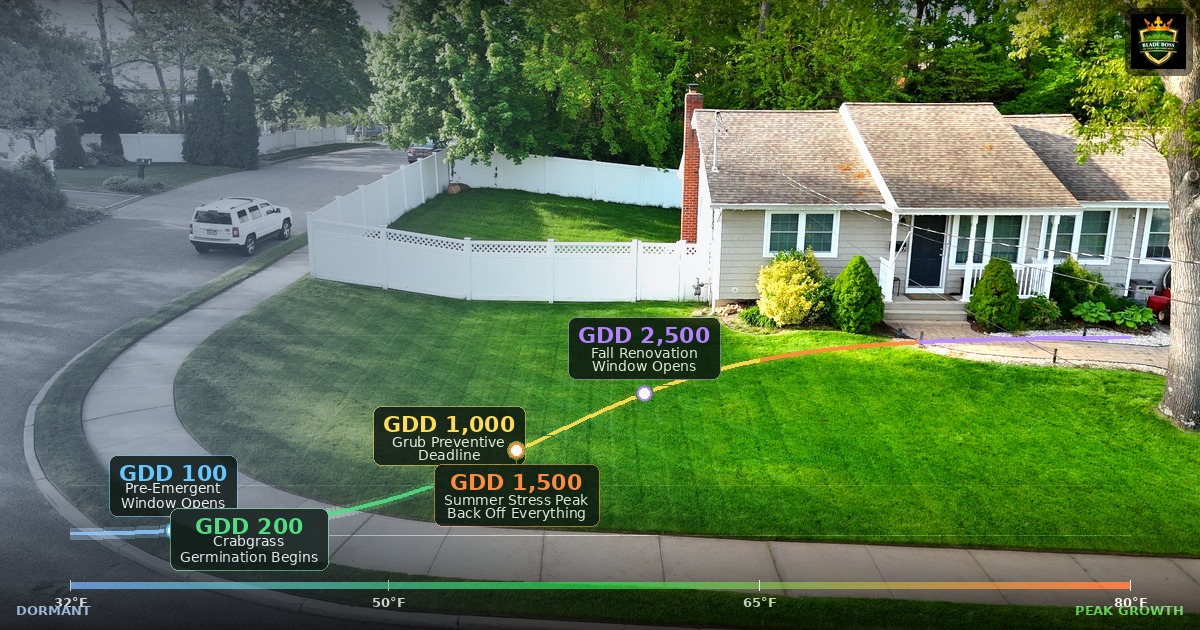
The GDD Milestone Calendar for Long Island Lawns
Join Long Island homeowners who get GDD updates, timing alerts, and data-driven lawn care tips every week.
This is the actionable part. Every major lawn care event maps to a GDD50 threshold. Here are the milestones that matter most for Long Island homeowners, sorted chronologically with approximate dates based on 30-year NOAA averages. Our complete Long Island lawn care calendar maps these into monthly task lists.
| GDD50 Threshold | Approximate Date | Lawn Care Event |
|---|---|---|
| 100 | ~Apr 6 | Pre-emergent window opens (apply by this date) |
| 200 | ~Apr 21 | Pre-emergent deadline / Crabgrass germination begins / First mow of season (grass at 3.5 to 4 inches) |
| 280 to 350 | ~May 28 to Jun 2 | Billbug adults active (scout sidewalks and driveways) |
| 375 | ~Jun 3 | Peak spring growth rate (mow every 5 to 7 days) |
| 500 | ~Jun 11 | Spring growth slowing, summer transition beginning |
| 750 to 950 | ~Jun 24 to Jul 2 | Chinch bug scouting window (check sunny, dry areas) |
| 1,000 to 1,200 | ~Jul 5 to Jul 12 | Japanese beetle peak / Grub preventive deadline / Summer stress onset |
| 1,500 to 2,000 | ~Jul 25 to Aug 15 | Peak summer stress / Chinch bug gen2 active |
| 2,050 | ~Aug 15 | Overseeding window opens (soil temps declining) |
| 2,500 | ~Sep 7 | Fall renovation peak (ideal seeding conditions) |
| 3,100 | ~Nov 1 | Season winding down, approaching full dormancy |
These dates are 30-year averages for Long Island. In any given year, actual dates can shift 7 to 16 days in either direction. A warm March pushes everything earlier. A cold, rainy April delays everything. The GDD50 thresholds are the constants. Always follow the GDD number from your tracker, not the approximate date in this table.
Phenological Indicators: Nature's GDD Cheat Sheet
Before GDD calculators existed, farmers and gardeners used plant bloom times to predict biological events. These are called phenological indicators, and they still work beautifully as a backup to (or confirmation of) your GDD tracking. Different plants bloom at predictable GDD50 accumulations, so when you see them flowering, you know approximately where the GDD bank stands.
| Plant Indicator | Approx. GDD50 | What It Tells You |
|---|---|---|
| Forsythia begins blooming | ~85 to 100 | Pre-emergent window is opening. Get your product down. |
| Forsythia in full bloom | ~116 | Pre-emergent should be applied. Crabgrass approaching germination. |
| Lilac begins blooming | ~150 to 200 | Crabgrass germination starting. Your barrier better be in place. |
| Dogwood in bloom | ~200 to 250 | Pre-emergent deadline has passed. Switch to dithiopyr if needed. |
| Iris blooming | ~350 to 500 | Spring growth peak. Mow frequently. Disease watch starts. |
| Rose of Sharon blooming | ~1,000 to 1,500 | Summer stress. Japanese beetles active. Raise mowing height. |
The beauty of phenological indicators is that they adjust automatically to your exact microclimate. If your yard is in a warm pocket near pavement, the forsythia in your yard will bloom earlier than one in a shaded north-facing yard half a mile away. The plant is responding to the same accumulated heat that the weeds and insects respond to. When your forsythia blooms, your soil is ready.
See Every Milestone on the Live Zone Calendar
The Blade Boss calendar inside Lawn Map Pro™ maps every GDD milestone, soil temperature threshold, and phenological indicator into a visual timeline for your location. Month-by-month task lists update as your actual GDD accumulation progresses.
How GDD Changes the Way You Time Pre-Emergent
Our complete pre-emergent timing guide covers this in depth, but here's the GDD-based approach in a nutshell. Traditional advice says "apply when soil hits 55°F." That's a useful single-day snapshot, but GDD adds a layer of precision because it accounts for how long the soil has been warming, not just today's reading.
On Long Island, the pre-emergent strategy maps to GDD50 like this: your target window is GDD50 between 100 and 200. The window typically opens around April 6 (100 GDD50) and your hard deadline is approximately April 21 (200 GDD50), which is when crabgrass germination becomes imminent. Soil temperature approaching 50°F at 4-inch depth serves as secondary confirmation. If you're past 200 GDD50 without a barrier in the ground, switch to dithiopyr (Dimension), which has early post-emergent activity on young crabgrass seedlings.
GDD for Pest Timing
Pre-emergent gets the most attention, but GDD is just as powerful for pest management. Every insect in your lawn follows the same heat-driven biological clock. The date they show up changes every year, but the GDD50 threshold stays constant.
Japanese Beetles (1,000 to 1,200 GDD50)
Peak adult flight and egg-laying occurs between approximately July 5 and July 12 on Long Island. This is also your deadline for preventive grub control. On Long Island, the legal option is imidacloprid (BioAdvanced Season-Long or Merit 0.5G), applied late June to mid-July and watered in immediately. Chlorantraniliprole (GrubEx) is the most effective preventive nationally but is NYSDEC-restricted in Nassau and Suffolk Counties. The adults you see eating your roses in July are laying eggs in your lawn. Those eggs become the grubs that destroy turf in September. Getting preventive treatment down before 1,200 GDD50 is the key.
Chinch Bugs (750 to 950 GDD50)
First generation chinch bug nymphs become active between late June and early July. Start scouting sunny, dry areas of your lawn when GDD50 hits 750. Chinch bugs suck plant juices and inject toxins, creating irregular brown patches that look like drought stress but don't respond to watering. Check by pushing a bottomless can into the soil, filling with water, and watching for tiny black and white bugs floating to the surface.
Billbugs (280 to 350 GDD50)
Bluegrass billbug adults emerge in late May and early June. Look for them on sidewalks and driveways near the lawn. Billbug larvae feed inside grass stems, causing random dead patches that pull up easily because the stems are hollow. By the time you see damage, the larvae are already well-established, so early detection at the adult stage is critical.
Sod Webworm (800 to 1,000 GDD50 first generation)
First generation moths fly in early to mid-July. You'll see small buff-colored moths flushing from the lawn as you walk through it at dusk. The larvae (caterpillars) feed on grass blades, creating irregular thin patches. Second generation moths appear around 1,800 to 2,000 GDD50 (late August to early September). The second generation often causes more damage because populations have built up.
GDD for Fertilizer and Growth Management
GDD also helps you understand why your grass grows like crazy in May but barely moves in July. Cool-season grass grows most aggressively when daily mean temperatures are between 60 and 75°F, which corresponds to the rapid GDD50 accumulation phase from late April through June. When GDD50 accumulation rate peaks in July (767 GDD50 in a single month), the temperatures have pushed past the optimal range and your grass shifts into survival mode.
This is why the Long Island lawn care calendar recommends starting with 0.50 lbs N per 1,000 sq ft in mid-April, with an optional 0.25 lbs bridge in late May. Use NitroCalc Pro™ for exact calculations. You're feeding during the growth phase and tapering off as GDD accumulation signals approaching summer stress, and always confirm your soil pH is in range before applying any amendments.
Once GDD50 hits approximately 1,150 (around July 11 on Long Island), summer stress has arrived. Stop fertilizing. Raise your mowing height to 4 inches. Shift from "grow" mode to "survive" mode. Your grass tells you this through the GDD curve, not the calendar.
Calculate Your Exact Fertilizer Rates
NitroCalc Pro™ handles the split-application math automatically. Enter your lawn size, grass type, and zone. Get exact product amounts and spreader settings calibrated to Long Island's sandy soil and Zone 7B growing season.
Answer 2 quick questions and see how GDD tracking can sharpen your timing.
How to Track GDD for Your Lawn
You have three options, from easiest to most hands-on.
Blade Boss Weather Hub
Weather Hub inside Lawn Map Pro™ tracks GDD50 accumulation automatically for your ZIP code using NOAA weather data. Alerts fire when key thresholds approach. Zero manual effort.
Online GDD Calculators
The Cornell NRCC turf GDD tracker and Syngenta's GreenCast tool both provide free GDD accumulation data by location. Good backup sources.
Manual Tracking
Buy a soil thermometer (under $15). Check your soil at 4-inch depth at the same time each day. Record the daily high and low air temps, run the formula, and keep a running total. Old school, but you get ground-truth data from YOUR specific yard.
GDD is calculated from air temperature, but your lawn lives in the soil. A $12 meat thermometer stuck 4 inches into the ground gives you real-time confirmation that your soil is tracking with the GDD model. If GDD says 100 but your shaded north-facing yard still reads 44°F at 4 inches, trust the thermometer for that specific zone and wait.
Why This Matters More Than You Think
I'm a Combat Search and Rescue pilot turned airline pilot. In both worlds, the mission depends on hitting exact thresholds at the right time. Nobody eyeballs fuel loads or guesses at approach speeds. We use instruments, data, and calculated parameters. GDD is the equivalent of an instrument approach for your lawn. It replaces guessing with measuring. It replaces "I think it's time" with "the data confirms it's time."
The difference between a good lawn and a great lawn on Long Island isn't the products you use. Most products work fine. The difference is timing. Apply pre-emergent two weeks too late and crabgrass wins. Fertilize in July when your grass is already stressed and you're feeding disease, not turf. Treat for grubs after the eggs have already hatched and you've wasted your money.
GDD eliminates those timing errors. It's free science that's been used in agriculture for decades. The only reason more homeowners don't use it is because nobody ever explained it simply enough. Now you know.
GDD data powers every timing decision in your lawn care program. Apply it to your fertilizer schedule, use it for grub treatment timing, and combine it with our spring recovery guide. The TTTF vs KBG comparison shows how GDD affects different grass types, and our clover control guide uses these same timing principles. Cool-season turfgrass research from Rutgers NJAES applies directly to Long Island growing conditions. Penn State Extension offers additional cool-season grass management resources for the Northeast. Blade Boss members also get access to the 15-Step Lawn Playbook for the complete system.
The GDD50 formula, key trigger thresholds (100, 250, 500, 1000+), and a fillable daily tracking log you can print and use all season.
See what Blade Boss members get and get real-time GDD tracking via Weather Hub, soil temperature estimates, and alert notifications for every major lawn care threshold. All calibrated to USDA Zone 7B. See what data-driven lawn care looks like.
See Plans →Frequently Asked Questions
What are growing degree days in lawn care?
Growing degree days (GDD) are a way of measuring how much heat has accumulated over time. Instead of looking at a calendar date, GDD counts the total warmth that plants, weeds, and insects have been exposed to since January 1. On any day where the average temperature exceeds a base temperature (50u00b0F for most lawn care applications), those extra degrees get added to a running total. This total predicts biological events like crabgrass germination, grub emergence, and optimal fertilizer timing more accurately than calendar dates because it accounts for year-to-year weather variation.
How do you calculate growing degree days?
To calculate GDD with a base of 50u00b0F (called GDD50), add the day's high temperature to the low temperature, divide by 2, then subtract 50. If the result is negative, count it as zero. Add each day's value to a running total starting January 1. For example, a day with a high of 68u00b0F and a low of 44u00b0F gives you (68 + 44) / 2 = 56, minus 50 = 6 GDD. The next day might add 4 more, bringing the cumulative total to 10 GDD.
What GDD should I apply pre-emergent on Long Island?
On Long Island (USDA Zone 7B), apply your first pre-emergent when GDD50 reaches 100, which historically falls around April 6. Soil temperature approaching 50u00b0F at 4-inch depth serves as secondary confirmation. Your deadline is GDD50 of 200 (approximately April 21), which is when crabgrass germination becomes imminent. Forsythia in full bloom is a natural indicator that your pre-emergent window is open.
What is GDD50 vs GDD32?
GDD50 uses a base temperature of 50u00b0F, meaning only heat above 50u00b0F counts toward the total. GDD32 uses a base of 32u00b0F, so nearly every day above freezing adds to the total. For lawn care on Long Island, GDD50 is the standard because 50u00b0F is the temperature at which cool-season grasses, weeds, and most turf insects begin active development. GDD32 is used in some agricultural and forestry models but is rarely needed for home lawn care.
When does crabgrass germinate based on GDD?
Crabgrass germination begins at approximately 200 GDD50, which corresponds to soil temperatures reaching 55u00b0F at 2 to 4 inch depth for several consecutive days. On Long Island, this typically occurs around April 21. Peak germination continues through 350 GDD50, with the heaviest flush from May through mid-June. Your pre-emergent barrier must be in place before GDD50 reaches 200 to be effective.
How do I track growing degree days for my lawn?
The easiest way to track GDD for your Long Island lawn is the Blade Boss Weather Hub inside Lawn Map Pro, which monitors GDD50 accumulation and soil temperature estimates in real time for your ZIP code. You can also calculate manually using daily high and low temperatures from your nearest weather station. The NOAA Regional Climate Centers and Cornell's Northeast Regional Climate Center both provide GDD accumulation data. A soil thermometer at 4-inch depth gives you ground-truth confirmation of what the GDD models predict.
Keep Reading
 DIY How-To
The Truth About Lawn Care Services on Long Island (DIY Comparison)
Long Island lawn services cost $1,200 to $3,000 a year and most treat your lawn identically to every...
 DIY How-To
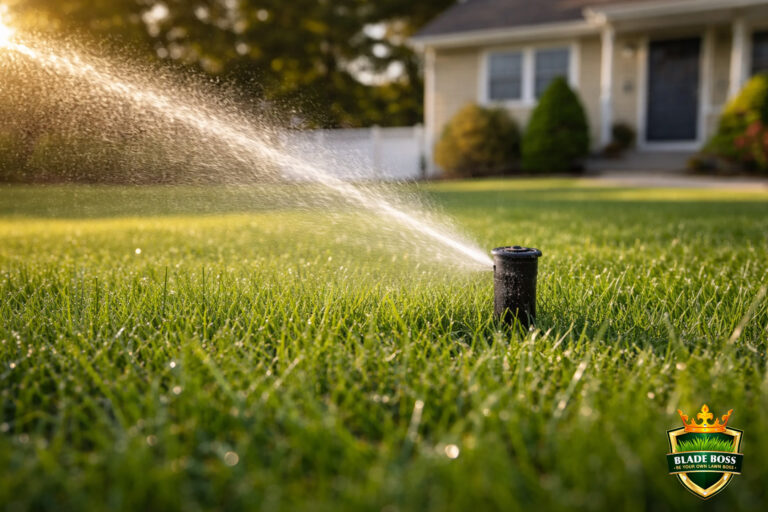
Long Island Lawn Irrigation Guide: How Much Water Does Your Lawn Actually Need?
Long Island gets 46 inches of rain a year. Your lawn still needs supplemental water. Learn exactly how...
 DIY How-To
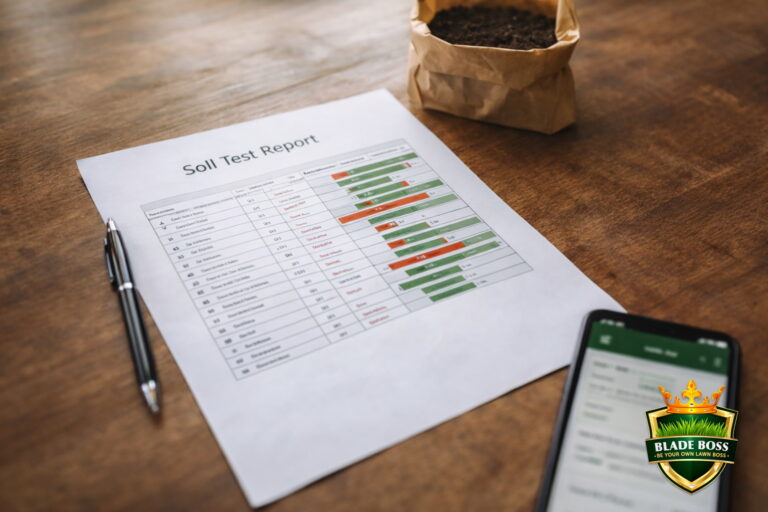
How to Read a Soil Test Report (And What to Do Next)
Your soil test came back. Now what? This guide walks through every number on the report, explains what...
Level Up Your Lawn Game
20+ pro calculators, satellite lawn mapping, and USDA zone-specific schedules. Built for Long Island and Northeast homeowners.
Create a free account to join the conversation.