

GUIDE IRR-03 · REV A
How to Do a Catch Cup Test and Find Your Real Run Times
You measured your water supply and you sized your zones. This is the test that proves it all actually works. A catch cup test tells you two things no spec sheet can: how evenly your sprinklers really cover the lawn, and exactly how many minutes to run each zone. Without it, every run time on your controller is a guess.
Pre-Flight Checklist - What You Need
As an Amazon Associate, Blade Boss earns from qualifying purchases. It never costs you a penny more.
Rules of Engagement (ROE's)
The Flight Plan - Step by Step
Pick One Zone and Grid Out Your Cups
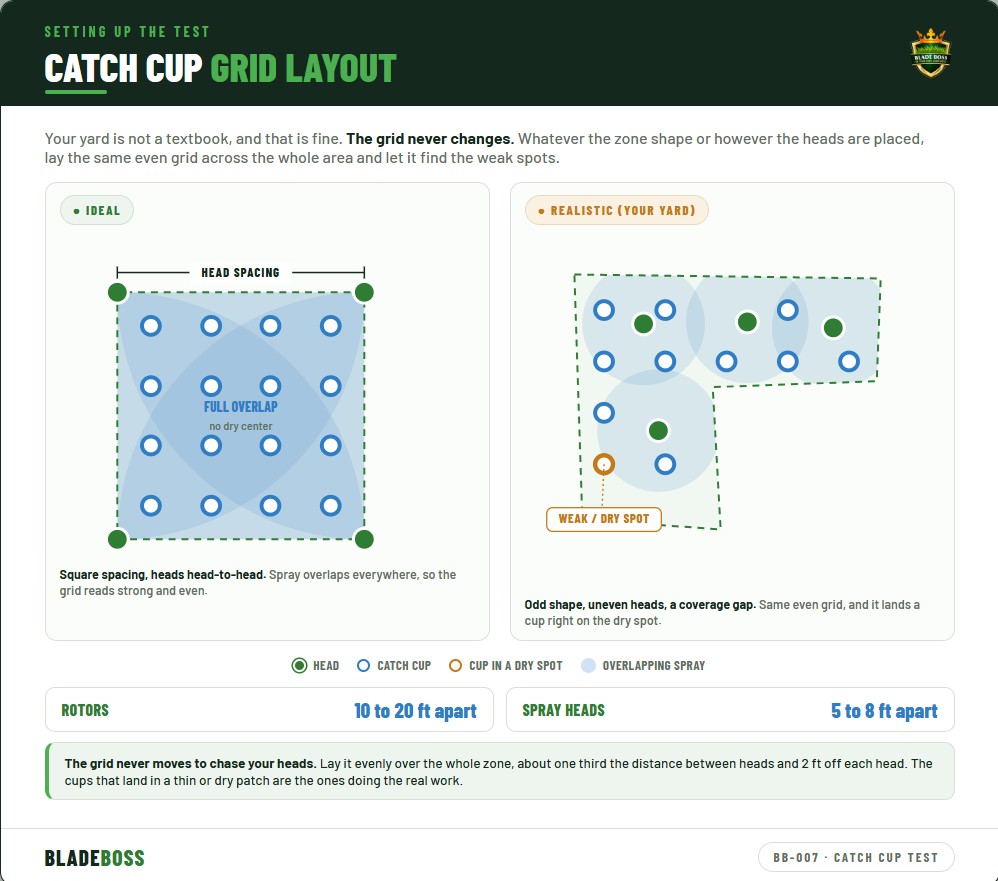
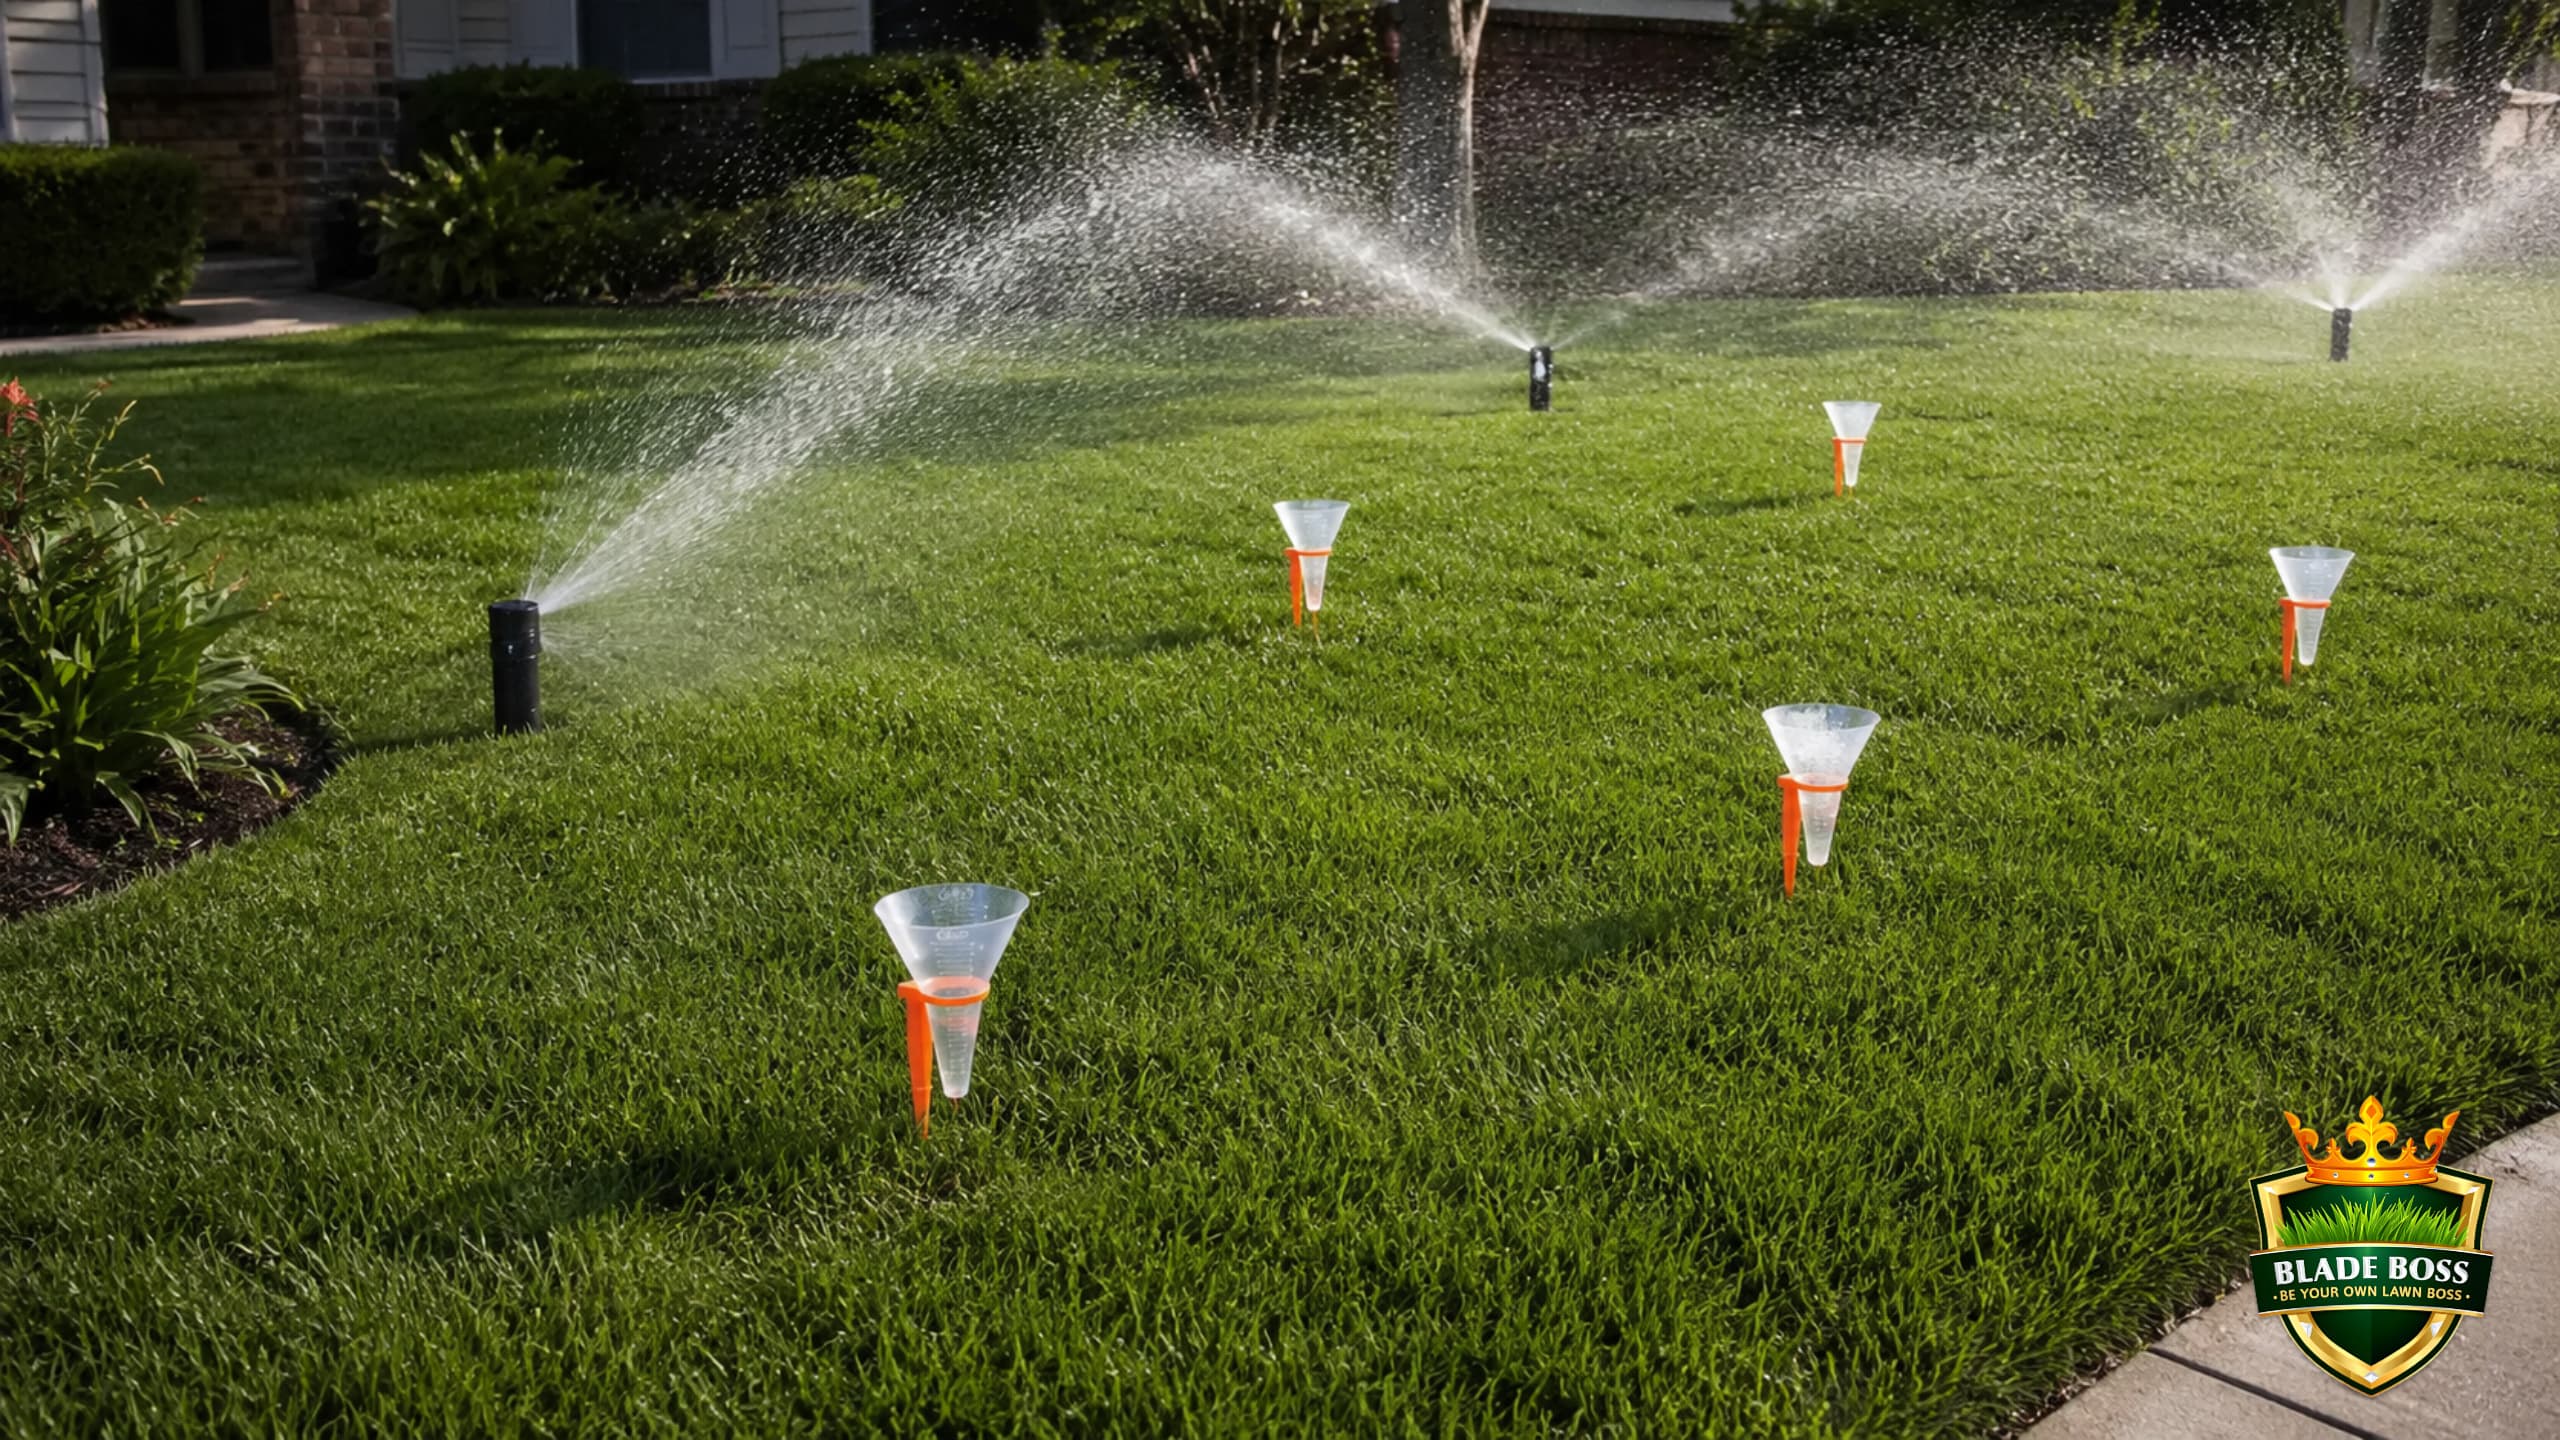
Test one zone at a time, always. Here is the part most people get wrong: do not scatter your cups by eye. Lay them out in an even grid across the whole zone so you sample every part of it equally, including the weak overlap areas between heads where coverage runs thinnest. This is how professional irrigation auditors do it, and the layout is what makes your result trustworthy.
- Space the grid by head type: about 10 to 20 feet apart for rotors, or 5 to 8 feet apart for spray heads. That is the spacing the pros use.
- More cups means a more accurate result. Eight to twelve covers a typical home zone, and a tighter grid is always better.
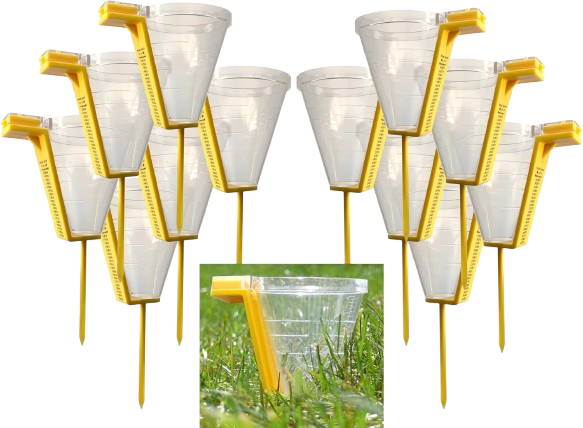
- Use identical straight-sided containers. Catch cups are cheap, but clean tuna cans work as long as every one is the same shape. Mismatched cups cannot be compared.
- A proper grid automatically lands cups near heads, far from heads, and in the dry overlap zones, which is exactly what you need to capture.
Run the Zone for a Timed Test
Run only that one zone, and time it exactly. A 15-minute run is the sweet spot: long enough to collect real water, and it makes the math dead simple later. Do not run other zones during the test, and hold off on water anywhere else in the house too, no showers, laundry, dishwasher, or hose. Anything else drawing water drops your pressure and changes the numbers.
Measure Every Cup
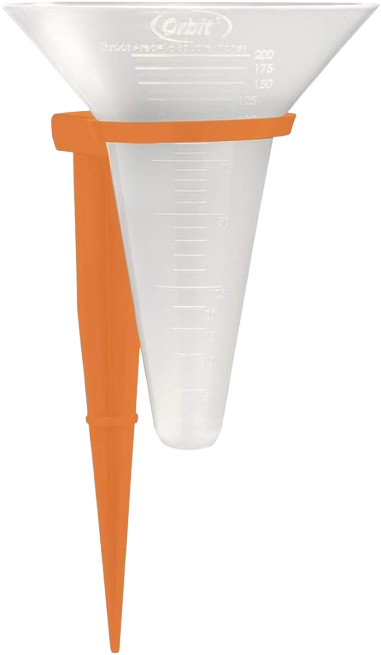
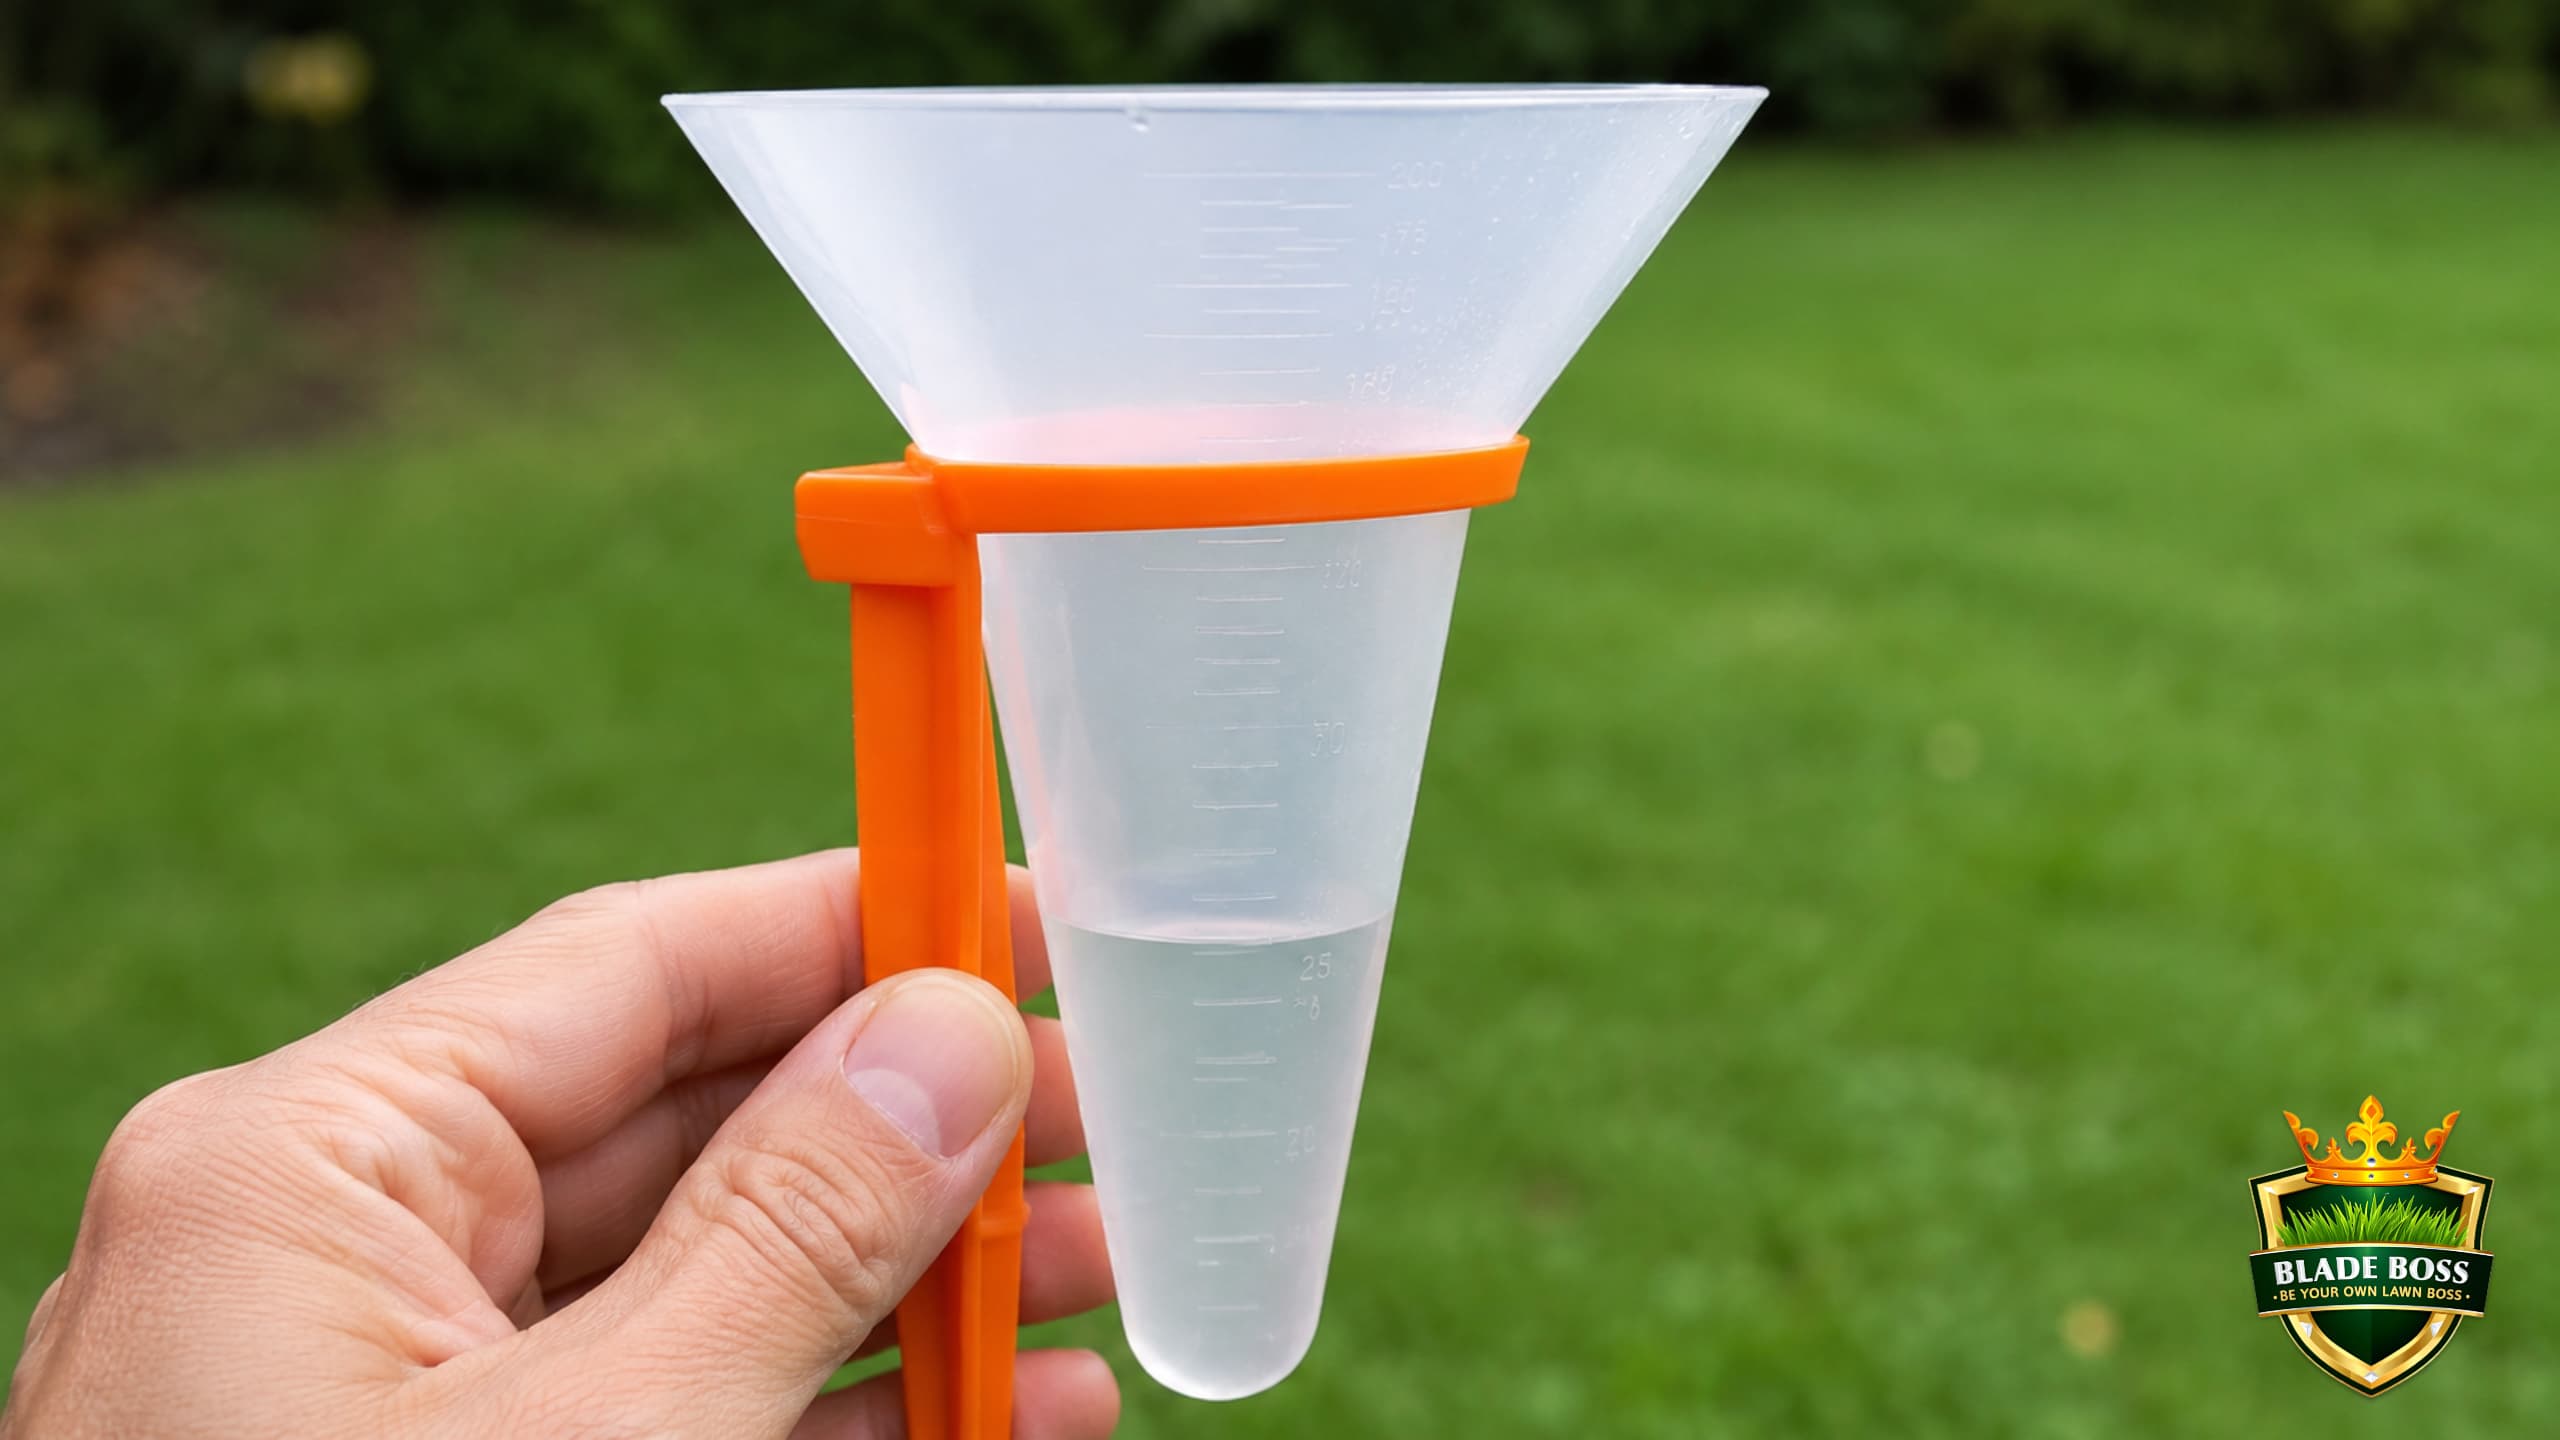
When the time is up, read the water level in each cup. A purpose-built catch cup like the Orbit has precipitation markings in inches printed right on the cone, so you read the depth straight off the side, no ruler needed. With DIY straight-sided cups, measure the depth with a ruler in inches instead. Either way, write down every single cup, in order.
Find Your Precipitation Rate
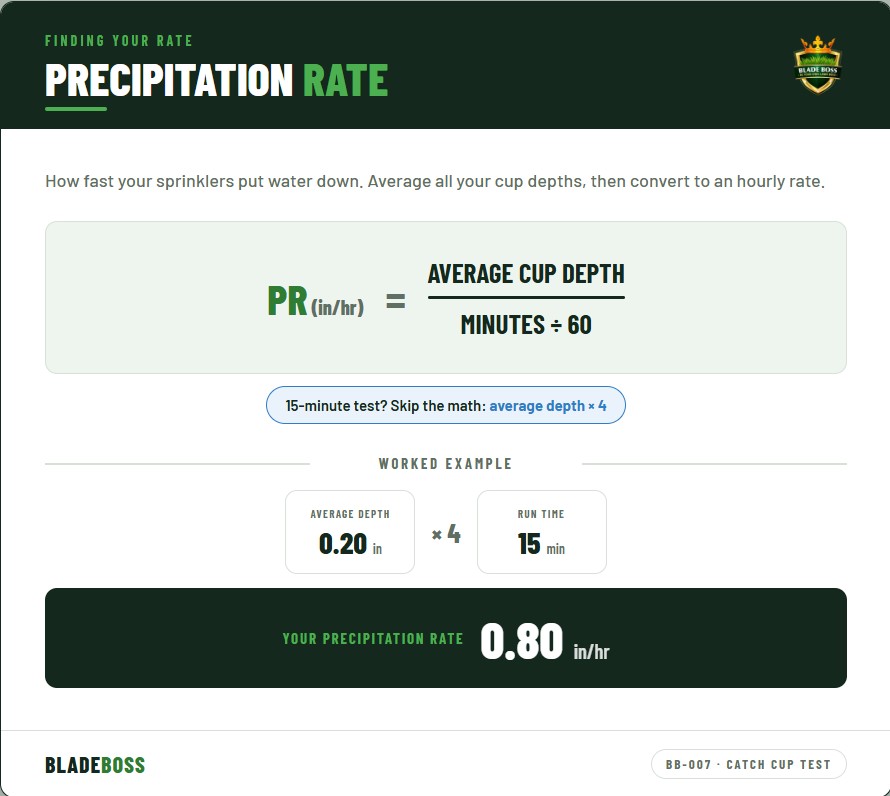
Average all your cup depths, then convert that to an hourly rate. The full formula is average depth divided by (minutes divided by 60). With a 15-minute test there is a shortcut: just multiply your average by 4, because 15 minutes is a quarter of an hour.
Example: your cups average 0.20 inches after 15 minutes. 0.20 x 4 = 0.80 in/hr. That is your real precipitation rate, the speed your sprinklers actually put water down.
Let CatchCup Pro Score It
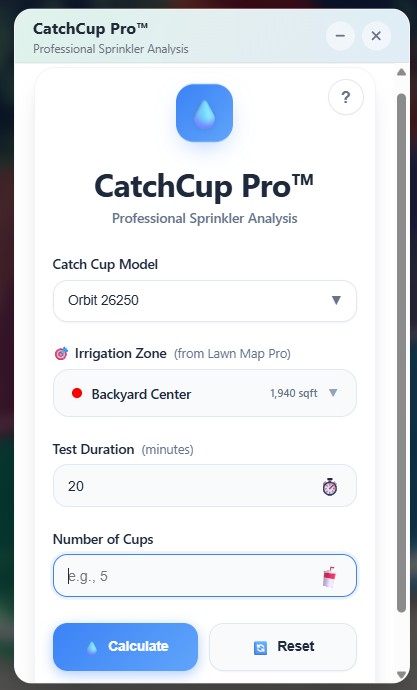
Enter your cup volumes and CatchCup Pro does the full analysis instantly: precipitation rate, distribution uniformity, a performance grade against the industry benchmark, and per-zone history so you can prove a repair actually worked. It turns a pile of cup readings into a clear scorecard.
Open CatchCup Pro →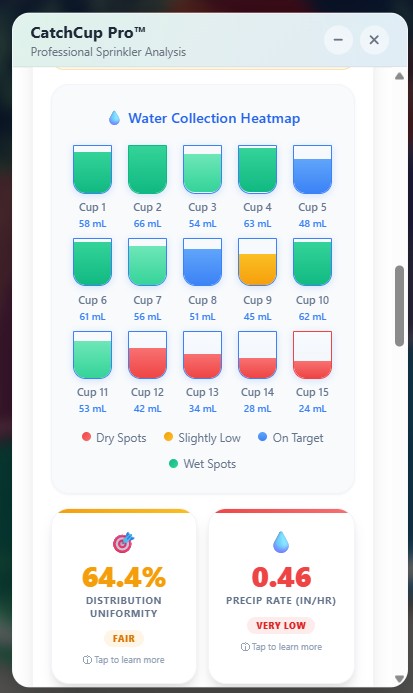
Check Your Distribution Uniformity
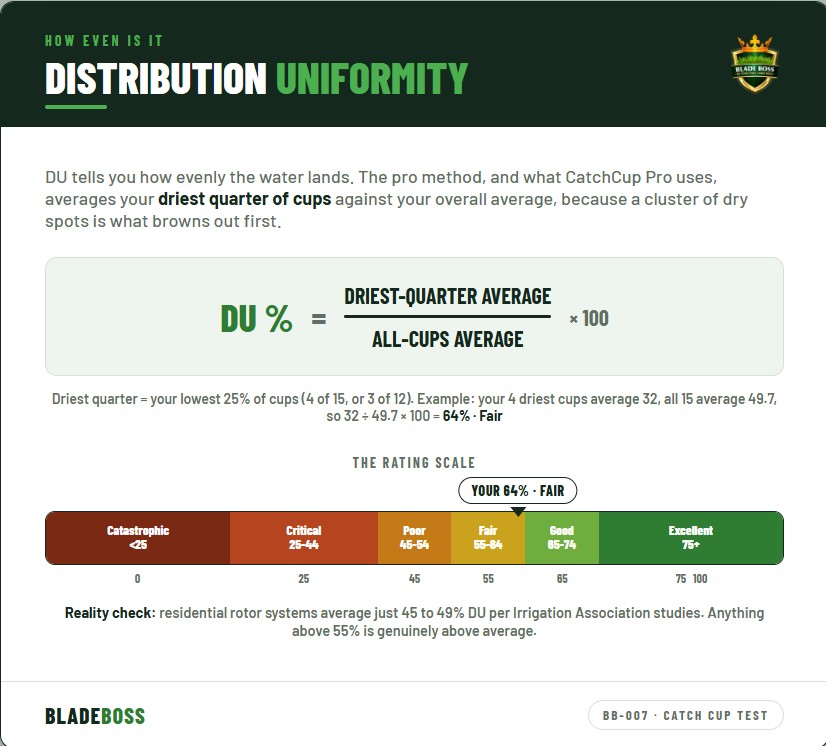
Precipitation rate tells you the speed. Distribution uniformity (DU) tells you the fairness, how evenly the water lands. The pro method, and what CatchCup Pro uses, averages your driest quarter of cups (not just the single lowest) and compares that to your overall average. Dry clusters are what brown out first, so they carry the weight.
DU = (average of your driest quarter of cups) divided by (average of all cups), times 100. Example: of 15 cups, your 4 driest average 32 and all 15 average 49.7, so DU = 32 divided by 49.7 times 100 = about 64 percent, which rates Fair.
Turn It Into a Run Time
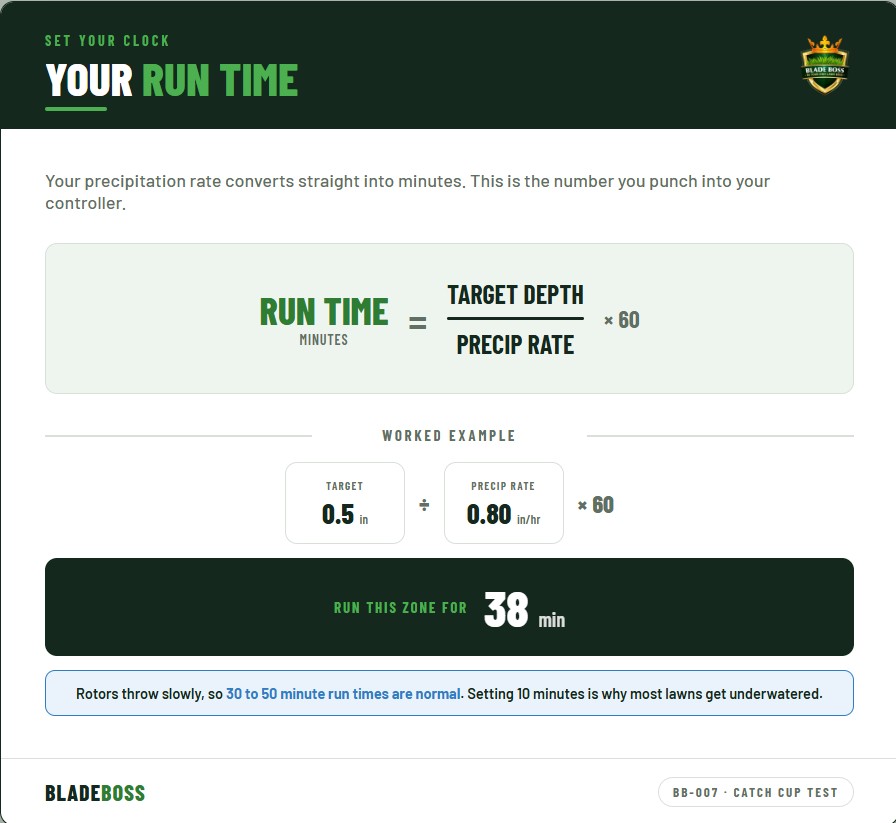
Here is the starting point. Your precipitation rate converts directly into minutes on the clock. Run time in minutes equals your target depth divided by your precipitation rate, times 60.
Example: on Long Island you want about 0.5 inches per session. At a measured 0.80 in/hr, that is 0.5 divided by 0.80, times 60 = about 38 minutes per run. That is your baseline number to start from.
Fix a Low DU
If your DU came back low (under about 55 percent), do not just crank the run time to soak the dry spots. That floods your wet spots and wastes water. Fix the cause instead, and almost every cause traces back to the earlier guides in this series.
Check head-to-head spacing (heads should reach each other), switch to matched-precipitation nozzles like MP Rotators, confirm your pressure is in the 30 to 45 PSI sweet spot at the head, and clear or replace clogged nozzles. Then re-test to prove the fix.
Just run the zone longer to get water to the dry spots. You will drown the wet spots, grow disease, and double your water bill while the dry spots still lag behind.
Abort Criteria - Common Mistakes
Mission Complete. Now Fly the Plan.
You have the cups, the math, and the method. Make it effortless: run your readings through CatchCup Pro for instant precipitation rate, a graded distribution uniformity score, and zone-by-zone history, so you can dial in every run time and prove your fixes worked.
Want This as a Printable Field Manual?
Drop your email and the print-ready PDF version lands in your hands. Take it to the lawn, no phone required.
Crew Questions - FAQ
How do I do a catch cup test on my sprinklers?
Lay at least 8 to 12 identical straight-sided cups in an even grid across one irrigation zone (about 10 to 20 feet apart for rotors, or 5 to 8 feet for spray heads), run only that zone for a timed period (15 minutes is easiest), then measure the water depth in every cup. A grid samples the whole zone evenly, including the weak overlap areas, which is what makes the result trustworthy. Average the depths for your precipitation rate, and compare your driest quarter of cups to the overall average for your distribution uniformity. Repeat for each zone.
How long should I run sprinklers for a catch cup test?
Fifteen minutes is the sweet spot. It collects enough water to measure and makes the math simple, since 15 minutes is a quarter hour, so your average depth times 4 gives your hourly precipitation rate. Any timed duration works if you use the full formula (average depth divided by minutes divided by 60).
What is a good distribution uniformity for a sprinkler system?
Distribution uniformity is measured by comparing your driest quarter of cups to your overall average. Residential rotor systems average just 45 to 49 percent DU per irrigation industry studies, so anything above 55 percent is genuinely above average. Above 65 percent is good and above 75 percent is excellent and rare in home systems. Under 55 percent points to a hardware problem with spacing, nozzles, or pressure.
How do I calculate my sprinkler precipitation rate?
Average the water depth across all your catch cups, then divide by the run time in hours. For a 15-minute test there is a shortcut: multiply your average depth by 4. For example, a 0.20-inch average over 15 minutes is a precipitation rate of 0.80 inches per hour.
How long should I run my sprinklers per zone?
Run time in minutes equals your target depth divided by your measured precipitation rate, times 60. To apply a half inch at a measured 0.80 in/hr, that is 0.5 divided by 0.80 times 60, or about 38 minutes. Rotors are slow, so 30 to 50 minute run times are normal, which is why so many people accidentally underwater them.
Why are some spots in my lawn always dry even though I water enough?
That is low distribution uniformity. Your sprinklers are putting more water in some places than others, so the dry spots starve no matter how long you run. The fixes are head-to-head spacing, matched-precipitation nozzles, correct pressure, and clearing clogged nozzles. Running longer only floods the wet spots.